TechOps Examples
Hey — It's Govardhana MK 👋
Welcome to another technical edition.
Every Tuesday – You’ll receive a free edition with a byte-size use case, remote job opportunities, top news, tools, and articles.
Every Thursday and Saturday – You’ll receive a special edition with a deep dive use case, remote job opportunities, and articles.
👋 Before we begin... a big thank you to today's sponsor ATTIO
Finally, a powerful CRM—made simple.
Attio is the AI-native CRM built to scale your company from seed stage to category leader. Powerful, flexible, and intuitive to use, Attio is the CRM for the next-generation of teams.
Sync your email and calendar, and Attio instantly builds your CRM—enriching every company, contact, and interaction with actionable insights in seconds.
With Attio, AI isn’t just a feature—it’s the foundation.
Instantly find and route leads with research agents
Get real-time AI insights during customer conversations
Build AI automations for your most complex workflows
Join fast growing teams like Flatfile, Replicate, Modal, and more.
👀 Remote Jobs
Sagent is hiring a Devops Engineer Principal
Remote Location: Worldwide
Effectual is hiring a Cloud Migration Engineer
Remote Location: Worldwide
📚 Resources
Looking to promote your company, product, service, or event to 53,000+ Cloud Native Professionals? Let's work together. Advertise With Us
🧠 DEEP DIVE USE CASE
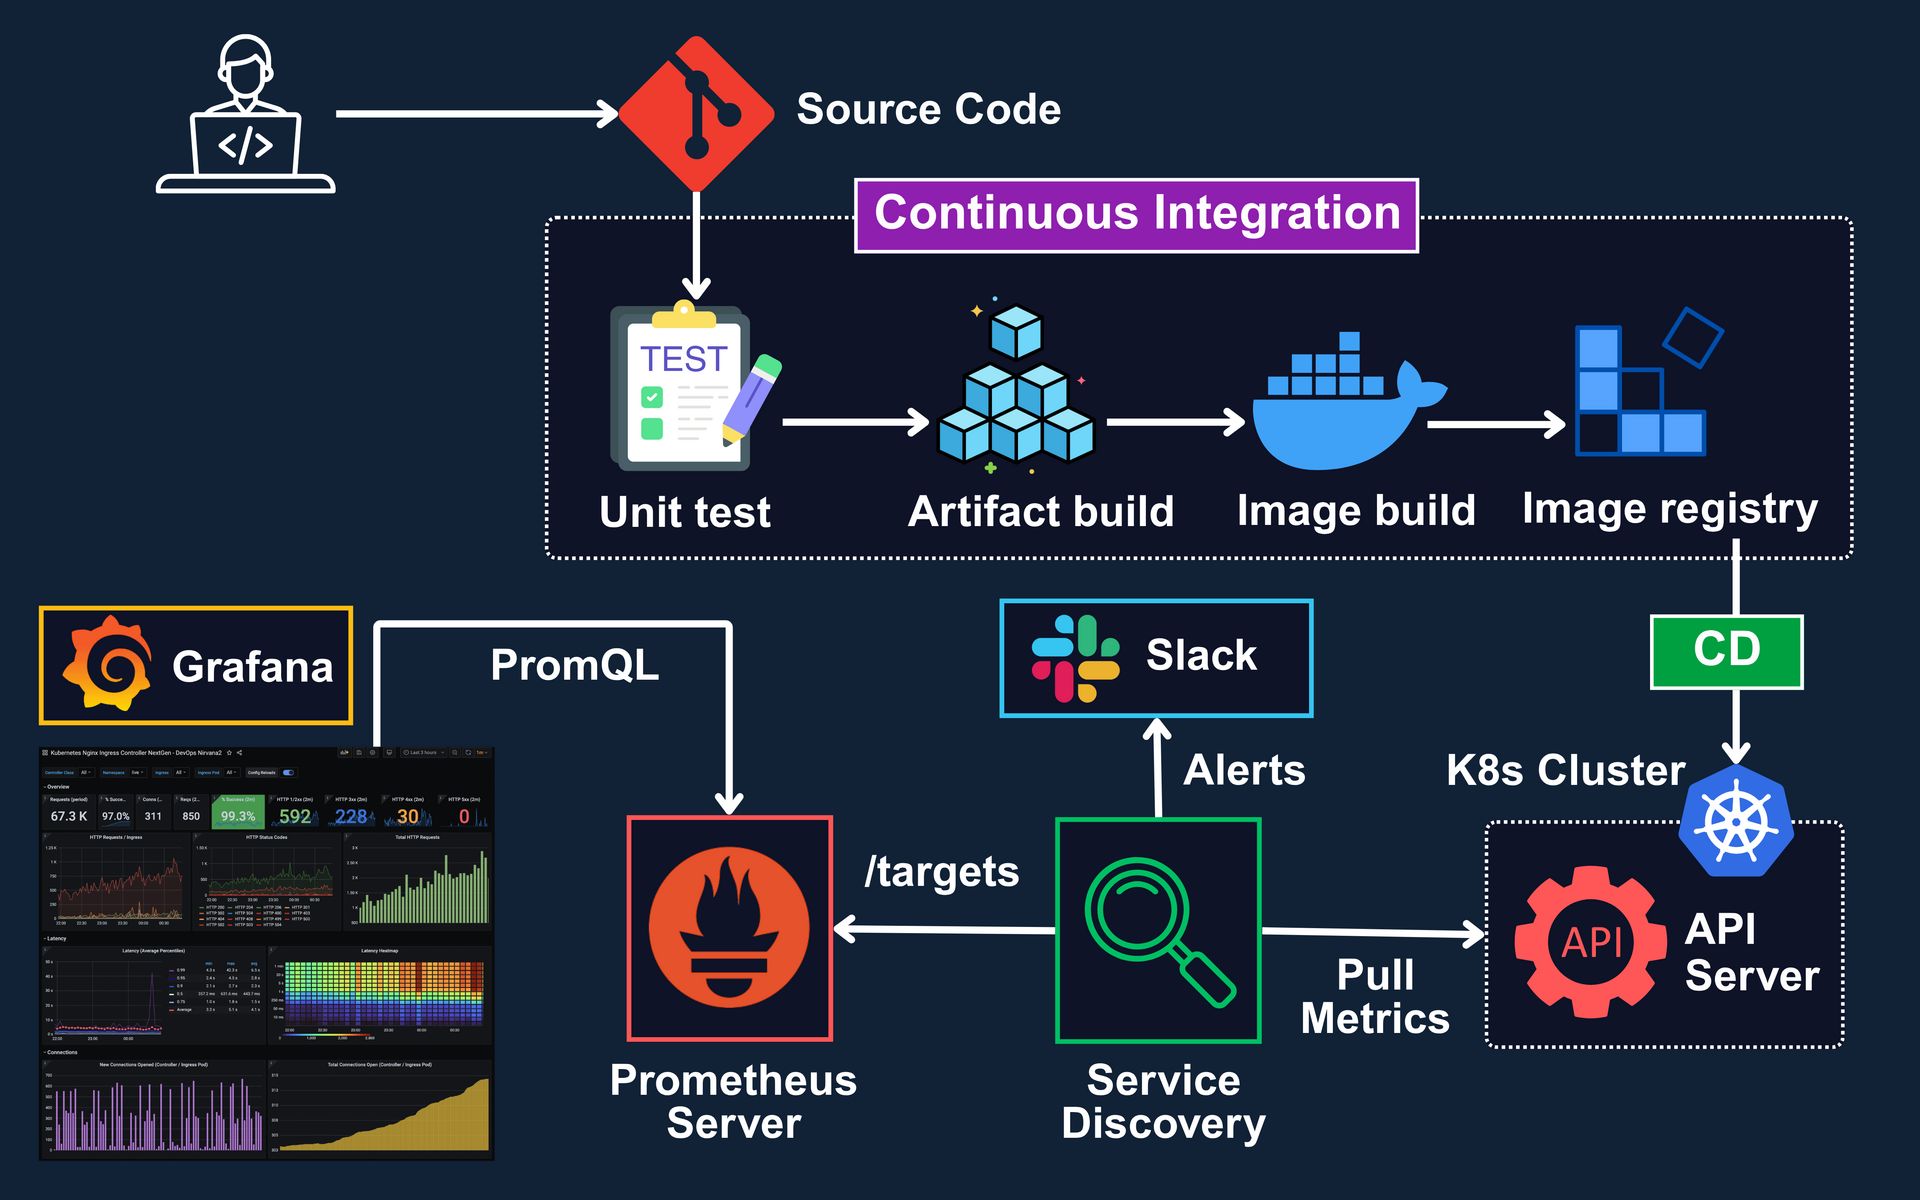
Kubernetes Monitoring with Prometheus and CICD Pipelines
Before jumping into Prometheus or Kubernetes specific tooling, it’s important to align on what monitoring actually is and why it matters.
What is Monitoring?
Monitoring is the process of collecting, processing, and analyzing system level data to understand the health and performance of your infrastructure and applications. It answers questions like:
Is the application running as expected?
Are there bottlenecks or anomalies?
Is resource usage within safe limits?
Monitoring is not alerting, alerting is an outcome derived from it.

The Four Golden Signals
Google’s Site Reliability Engineering (SRE) guidelines define four key metrics to monitor any system:
Latency – How long does it take to serve a request?
Traffic – How much demand is being placed on your system?
Errors – What is the rate of failing requests?
Saturation – How full is your service (CPU, memory, I/O, etc.)?
These signals help prioritize what to observe, even in a Kubernetes environment. and Prometheus is designed to collect these metrics at scale.
Why Prometheus for Kubernetes Monitoring?
Prometheus is a pull based time series database with native Kubernetes support. It discovers targets automatically, scrapes metrics using HTTP endpoints, and stores the data locally for analysis and alerting. Reasons Prometheus fits Kubernetes well:
Native support for Kubernetes Service Discovery
Works seamlessly with kube-state-metrics and node-exporter
Rich query language (PromQL)
Integration with Alertmanager and Grafana
Typical Kubernetes Monitoring Pipeline:

1. Metric Sources
Application level metrics (/metrics endpoint with libraries like prometheus-client)
Node-level metrics via node-exporter
Cluster state metrics via kube-state-metrics
2. Prometheus Server
Scrapes metrics from above sources
Applies relabeling and filters via config
Stores time-series data locally
3. Alerting
Prometheus pushes alert conditions to Alertmanager
Alertmanager routes alerts to email, Slack, PagerDuty, etc.
You define conditions like: job_duration_seconds > 95th_percentile for 5m
4. Visualization
Data from Prometheus is queried via Grafana
Dashboards show node health, pod status, memory, CPU usage, and custom app metrics
Example PromQL to alert on long running jobs:
max_over_time(kube_job_duration_seconds_sum[5m])
/
max_over_time(kube_job_duration_seconds_count[5m])
> 120
This triggers when the average job duration over the last 5 minutes exceeds 2 minutes.
Having established the basics of monitoring and how a pipeline looks like, let us move into how the actual behind the scenes metric flow happens inside a Kubernetes cluster.
I am giving away 50% OFF on all annual plans of membership offerings for a limited time.
A membership will unlock access to read these deep dive editions on Thursdays and Saturdays.
Upgrade to Paid to read the rest.
Become a paying subscriber to get access to this post and other subscriber-only content.
UpgradePaid subscriptions get you:
- Access to archive of 200+ use cases
- Deep Dive use case editions (Thursdays and Saturdays)
- Access to Private Discord Community
- Invitations to monthly Zoom calls for use case discussions and industry leaders meetups
- Quarterly 1:1 'Ask Me Anything' power session


