TechOps Examples
Hey — It's Govardhana MK 👋
Welcome to another technical edition.
Every Tuesday – You’ll receive a free edition with a byte-size use case, remote job opportunities, top news, tools, and articles.
Every Thursday and Saturday – You’ll receive a special edition with a deep dive use case, remote job opportunities, and articles.
👋 Before we begin... a big thank you to today's sponsor OPENOPS
Check out OpenOps — a no-code FinOps automation platform that helps FinOps and DevOps teams reduce cloud costs and streamline financial operations.
Enjoy customizable workflows that automate FinOps processes, including cost optimization, budgeting, forecasting, allocation, and tagging.
OpenOps integrates with AWS, Azure, and GCP, as well as third-party FinOps visibility tools, collaboration platforms, telemetry systems, and databases.
We’re also running a LIVE event for each platform where:
✅ You’ll learn how to automate cloud cost optimization with our platform partners
⚙️ We’ll show real workflows across all major FinOps platforms and major CSPs
🙋♀️ And yes—ask anything. We’ll be there, live, answering as we go.
👀 Remote Jobs
Invisible AI is hiring a Senior Site Reliability Engineer
Remote Location: Worldwide
Binance is hiring a DevSecOps Engineer
Remote Location: APAC
📚 Resources
Looking to promote your company, product, service, or event to 50,000+ Cloud Native Professionals? Let's work together. Advertise With Us
🧠 DEEP DIVE USE CASE
Kubernetes Logging Using ELK Stack
Logging is a basic but critical need in any Kubernetes environment. When containers crash or pods get rescheduled, native logs often vanish. Developers and operators need a system that can collect, process, store, and visualize logs in one place. ELK Stack provides this workflow in a structured way.
What is ELK Stack?
ELK stands for Elasticsearch, Logstash, and Kibana. It is often extended with Beats to form a complete logging pipeline. Each component handles a specific stage in the log lifecycle:

Beats collects data from the source system.
Logstash retrieves and processes this data.
Elasticsearch stores the data in an indexed format.
Kibana visualizes the data for analysis.
This structure is simple and modular, making it suitable for dynamic environments like Kubernetes.
Breakdown of Components

The Elastic Stack groups its tools into three areas of responsibility.
1. Ingest: Handles collection, preprocessing, and shipping
Beats, APM, and Elastic Agent collect and ship logs.
Logstash and Ingest Pipelines process and enrich data.
2. Store: Handles indexing, storing, and searching
Elasticsearch keeps logs in a queryable format.
3. Consume: Handles visualization and analysis
Kibana is used to explore, search, and alert on logs.
Shipping Logs with Filebeat Inside Kubernetes

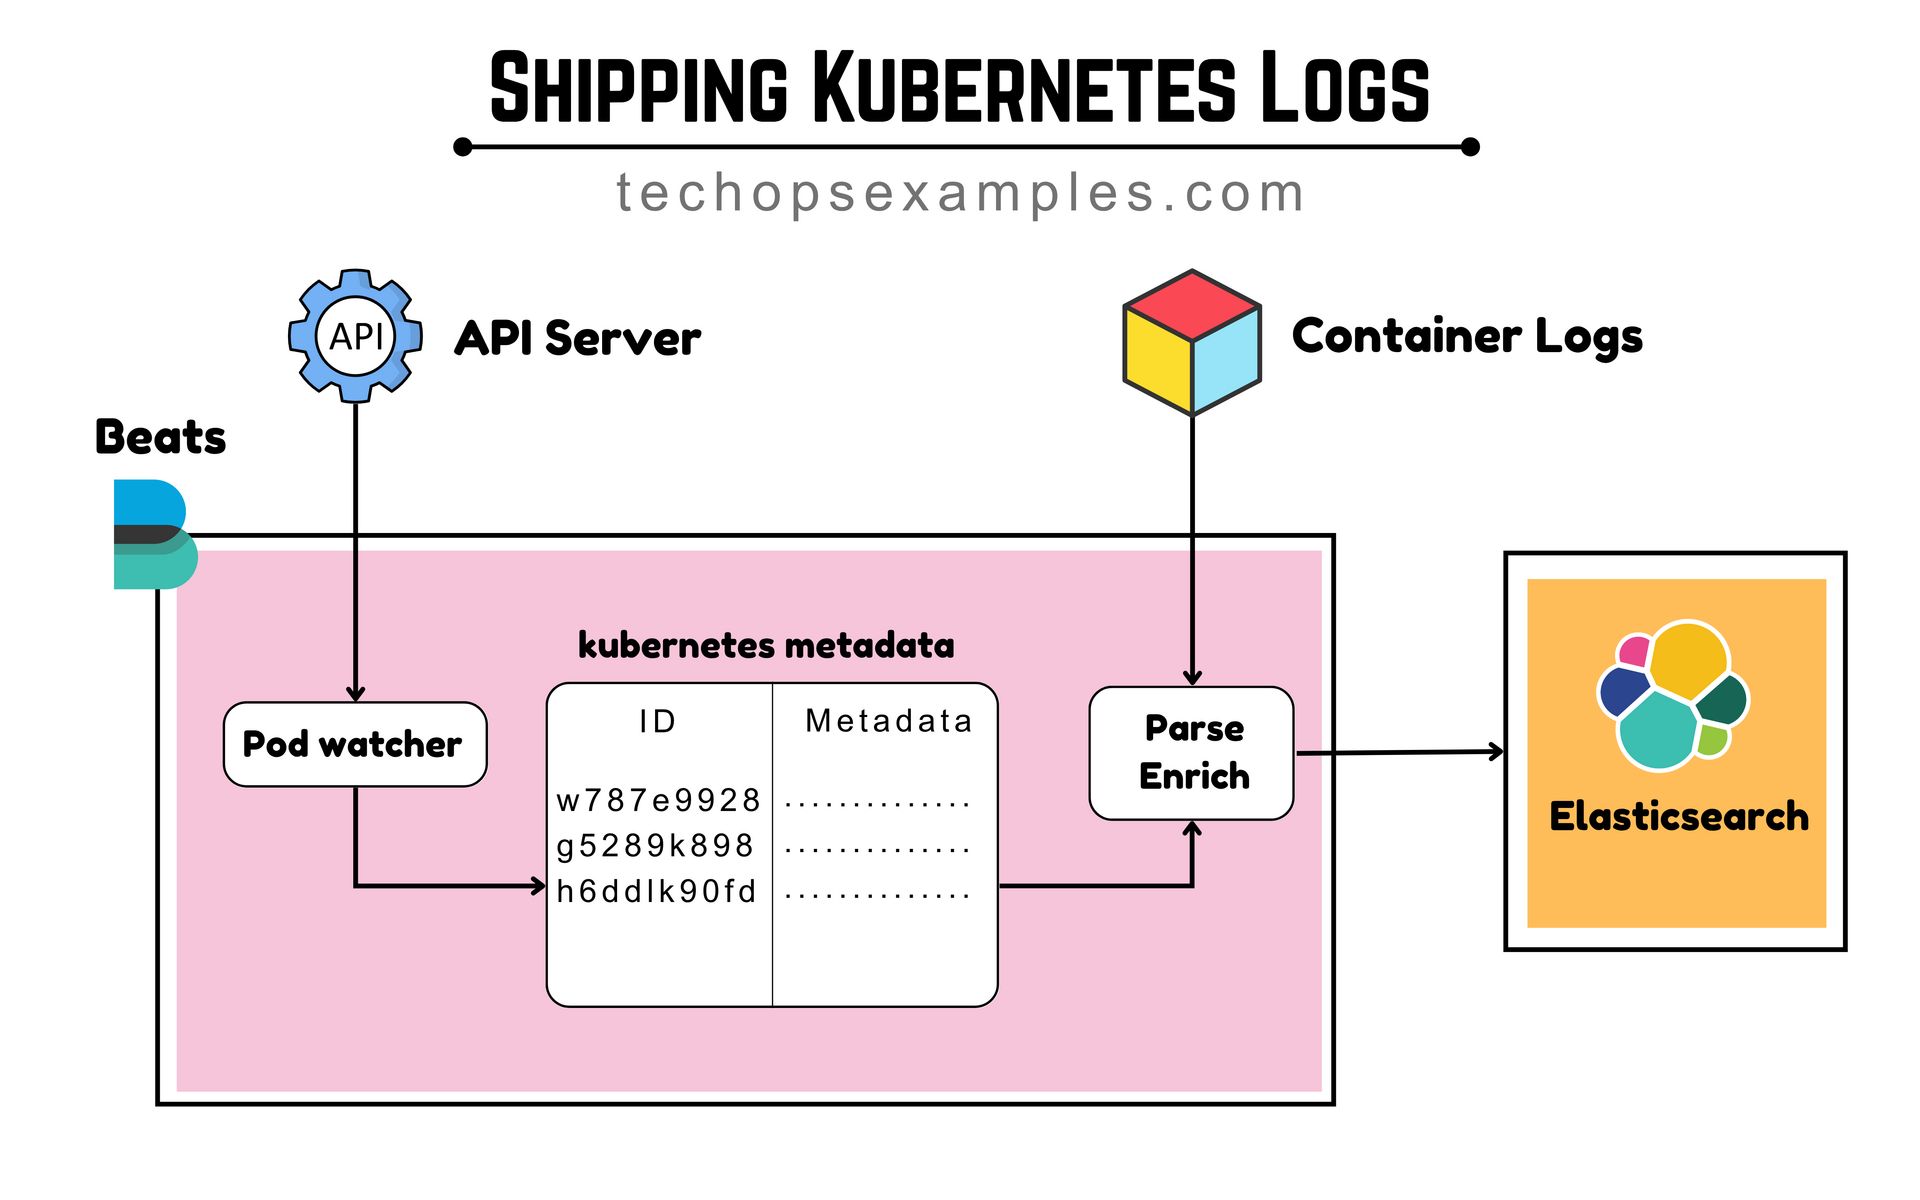
Filebeat runs as a DaemonSet and handles log collection on each node. Here's how it works:
Pod Watcher inside Filebeat connects to the Kubernetes API Server to watch for pod events and pull metadata like pod ID, name, namespace, and labels.
It also reads container logs from /var/log/containers/ in real time.
Each log line is enriched with Kubernetes metadata, allowing you to filter logs in Elasticsearch by pod, namespace, or label.
Logs are optionally parsed to extract fields or structured JSON.
Finally, enriched logs are pushed to Elasticsearch, making them ready for search and visualization in Kibana.
Now that we’ve covered the basics of the Elastic Stack, let’s look into how to practically implement inside a Kubernetes environment
I am giving away 50% OFF on all annual plans of membership offerings for a limited time.
A membership will unlock access to read these deep dive editions on Thursdays and Saturdays.
Upgrade to Paid to read the rest.
Become a paying subscriber to get access to this post and other subscriber-only content.
UpgradePaid subscriptions get you:
- Access to archive of 200+ use cases
- Deep Dive use case editions (Thursdays and Saturdays)
- Access to Private Discord Community
- Invitations to monthly Zoom calls for use case discussions and industry leaders meetups
- Quarterly 1:1 'Ask Me Anything' power session


