TechOps Examples
Hey — It's Govardhana MK 👋
Welcome to another technical edition.
Every Tuesday – You’ll receive a free edition with a byte-size use case, remote job opportunities, top news, tools, and articles.
Every Thursday and Saturday – You’ll receive a special edition with a deep dive use case, remote job opportunities, and articles.
👋 👋 A big thank you to today's sponsor THE DEEP VIEW
Become An AI Expert In Just 5 Minutes
If you’re a decision maker at your company, you need to be on the bleeding edge of, well, everything. But before you go signing up for seminars, conferences, lunch ‘n learns, and all that jazz, just know there’s a far better (and simpler) way: Subscribing to The Deep View.
This daily newsletter condenses everything you need to know about the latest and greatest AI developments into a 5-minute read. Squeeze it into your morning coffee break and before you know it, you’ll be an expert too.
Subscribe right here. It’s totally free, wildly informative, and trusted by 600,000+ readers at Google, Meta, Microsoft, and beyond.
👀 Remote Jobs
Railway is hiring a Senior Infra Engineer: Observability
Remote Location: Worldwide
Wikimedia is hiring a Senior Site Reliability Engineer
Remote Location: Worldwide
Powered by: Jobsurface.com
📚 Resources
Looking to promote your company, product, service, or event to 59,000+ Cloud Native Professionals? Let's work together. Advertise With Us
🧠 DEEP DIVE USE CASE
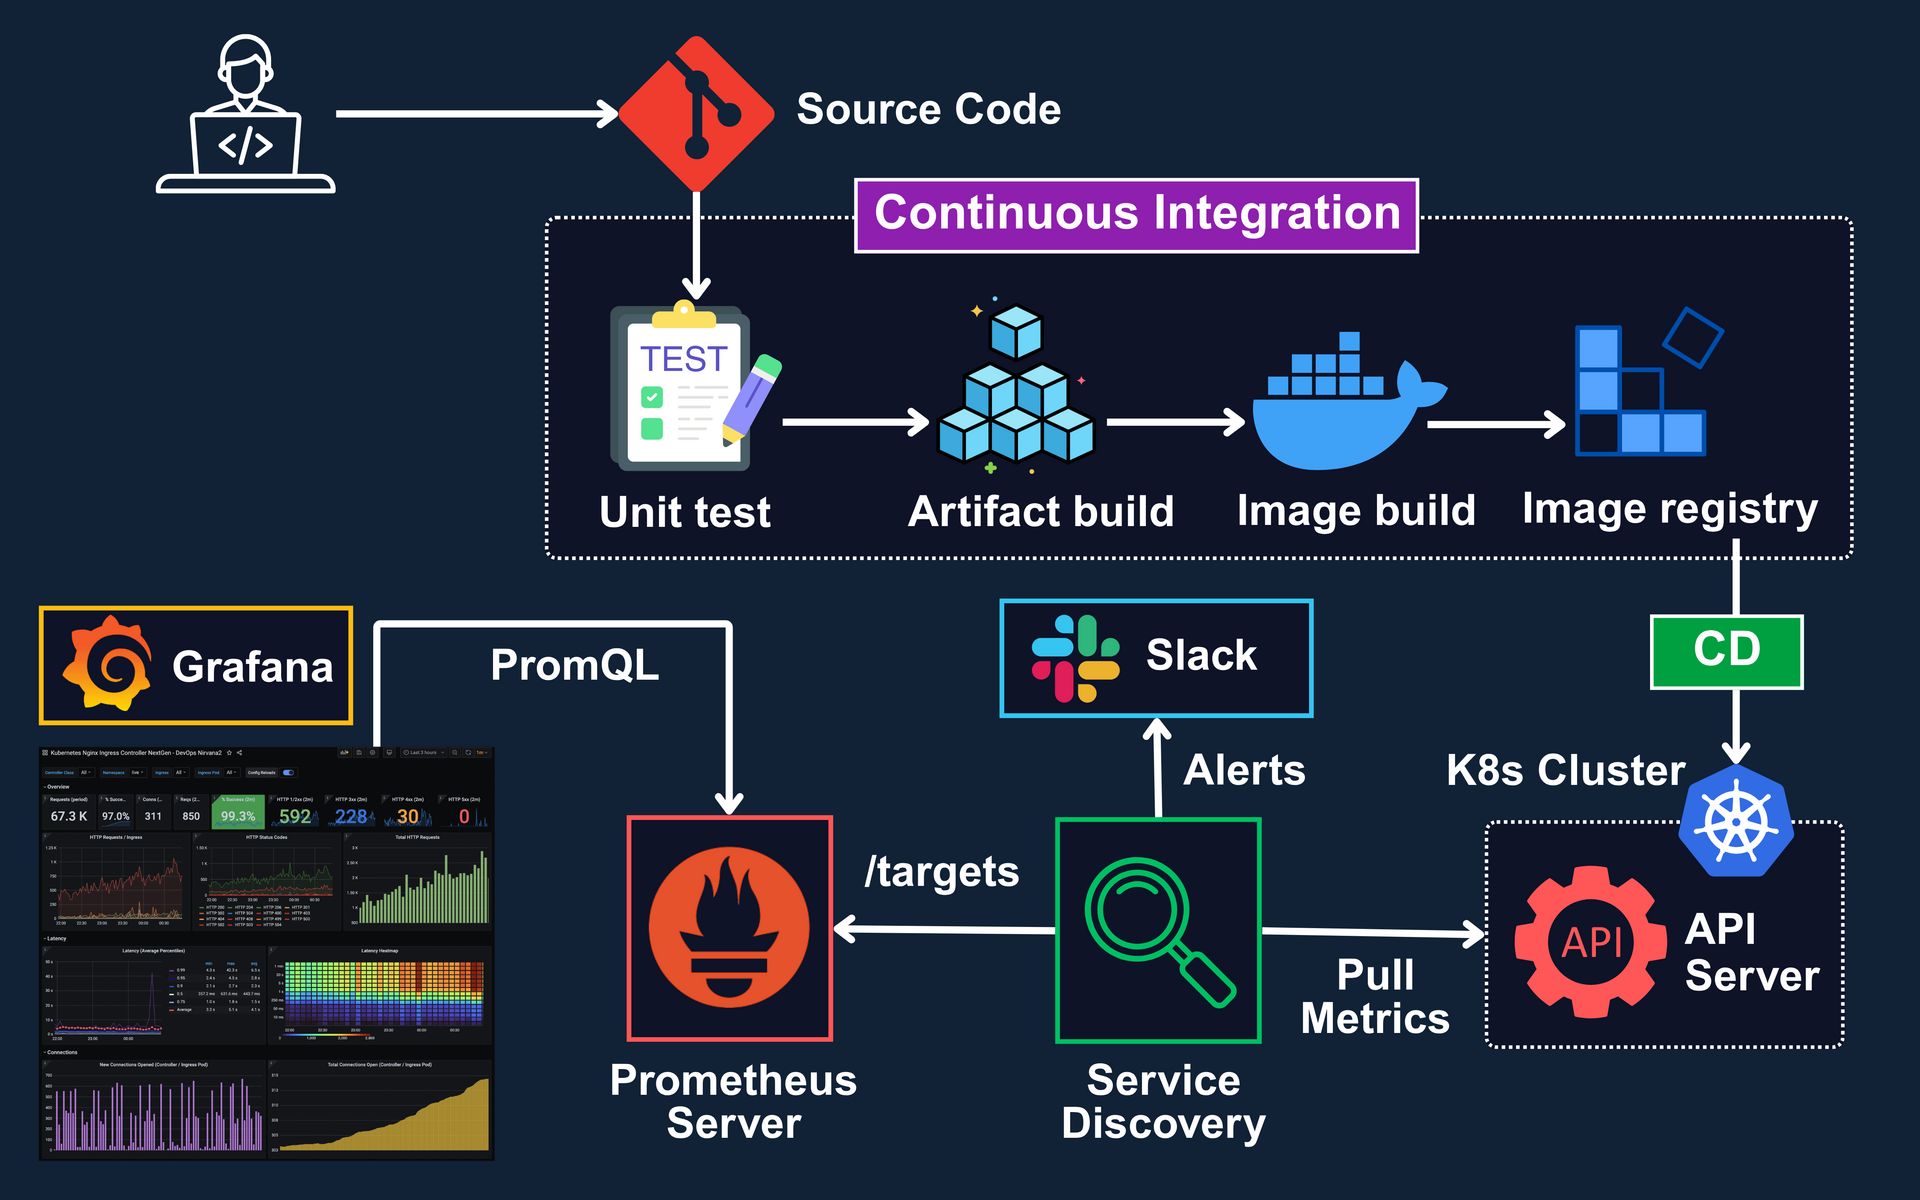
How to Design Kubernetes Monitoring for CI CD Workflows
Before jumping into specific tooling, it’s important to align on what monitoring actually is and why it matters.
What is Monitoring?
Monitoring is the process of collecting, processing, and analyzing system level data to understand the health and performance of your infrastructure and applications. It answers questions like:
Is the application running as expected?
Are there bottlenecks or anomalies?
Is resource usage within safe limits?
Monitoring is not alerting, alerting is an outcome derived from it.

The Four Golden Signals
Google’s Site Reliability Engineering (SRE) guidelines define four key metrics to monitor any system:
Latency – How long does it take to serve a request?
Traffic – How much demand is being placed on your system?
Errors – What is the rate of failing requests?
Saturation – How full is your service (CPU, memory, I/O, etc.)?
These signals help prioritize what to observe, even in a Kubernetes environment. and Prometheus is designed to collect these metrics at scale.
Why Prometheus for Kubernetes Monitoring?
Prometheus is a pull based time series database with native Kubernetes support. It discovers targets automatically, scrapes metrics using HTTP endpoints, and stores the data locally for analysis and alerting. Reasons Prometheus fits Kubernetes well:
Native support for Kubernetes Service Discovery
Works seamlessly with kube-state-metrics and node-exporter
Rich query language (PromQL)
Integration with Alertmanager and Grafana
Typical Kubernetes Monitoring Pipeline:

1. Metric Sources
Application level metrics (/metrics endpoint with libraries like prometheus-client)
Node-level metrics via node-exporter
Cluster state metrics via kube-state-metrics
2. Prometheus Server
Scrapes metrics from above sources
Applies relabeling and filters via config
Stores time-series data locally
3. Alerting
Prometheus pushes alert conditions to Alertmanager
Alertmanager routes alerts to email, Slack, PagerDuty, etc.
You define conditions like: job_duration_seconds > 95th_percentile for 5m
4. Visualization
Data from Prometheus is queried via Grafana
Dashboards show node health, pod status, memory, CPU usage, and custom app metrics
Example PromQL to alert on long running jobs:
max_over_time(kube_job_duration_seconds_sum[5m])
/
max_over_time(kube_job_duration_seconds_count[5m])
> 120
This triggers when the average job duration over the last 5 minutes exceeds 2 minutes.
Having established the basics of monitoring and how a pipeline looks like, let us move into how the actual behind the scenes metric flow happens inside a Kubernetes cluster.
🔴 Get my DevOps & Kubernetes ebooks! (free for Premium Club and Personal Tier newsletter subscribers)
Upgrade to Paid to read the rest.
Become a paying subscriber to get access to this post and other subscriber-only content.
UpgradePaid subscriptions get you:
- Access to archive of 250+ use cases
- Deep Dive use case editions (Thursdays and Saturdays)
- Access to Private Discord Community
- Invitations to monthly Zoom calls for use case discussions and industry leaders meetups
- Quarterly 1:1 'Ask Me Anything' power session


